Plotdb | visual chart making platform
Tag: Dynamic chart
Chinese Websites: https://plotdb.com/ Enter The Website
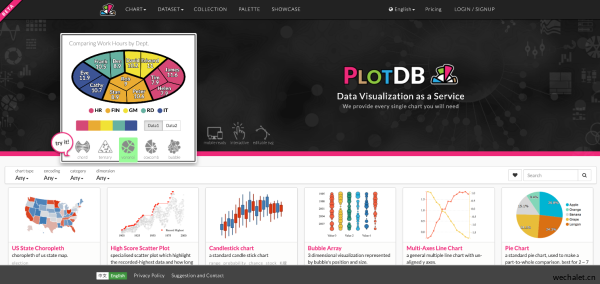
Plotdb is an online dynamic chart making tool developed by Taiwan's "data visualization" team. It provides hundreds of different chart styles for you to download after online production. If you want to make a variety of charts, you can start quickly even if you don't know how to develop and design.

Although you can see a lot of things when you click on the website at the beginning, it seems to be very complicated, but after the actual trial, it is not difficult. Moreover, it is not only very convenient for computer novices, but also a very good website for computer experts, especially for users who understand programs. Function can be simple or complex, completely depends on individual needs to choose their own function to use.
The website provides Chinese and English languages. You can click the function column on the left to select the type of chart you want to search. After finding the chart you like, click the chart to enter the following screen. There is a column on the far left for all the tool columns for making this chart. When making the chart, the place will be used. On the right side of the whole screen is the schematic diagram of the chart, and the left side is the generation Content information of the chart.
The content information of the chart can be directly input into plotdb to generate the chart immediately, or the existing Excel or CSV files can be directly imported to generate the chart. After the content of the chart is completed, you can go to the [style] of the left function bar to help the chart to make some visual adjustments. The fields and colors that you want to display in the chart can be set.
At present, free testing is open during the beta period. In the future, it should take the form of part free and part charging. For this kind of tool, it can completely simplify the user's operation mode and improve the work efficiency. No matter what kind of visual chart you make, you can use this tool to realize it.
Related Suggestion
Axhub Axure Prototype Hosting and Collaboration Platform
Axure Prototype Release and Collaboration Platform...
Reading: 186 2024-11-11


